Evaluating Brain Performance
During Brain training, Brain Builder performs measurements to determine the accuracy of the Brain that is being trained.
When images are uploaded and labeled, a portion of those images are not used to train the Brain, but rather are reserved as a Validation Set for testing. As the Brain is trained, the Brain makes predictions against the validation set and checks those predictions about the labels for the images. Those results determine how accurate the Brain is.
Notes about accuracy
The Validation Set is a random sampling of the images that are uploaded to Brain Builder to train the Brain. As such, the validation set should be a good indicator of how accurate the Brain's predictions are when used to analyze similar images.
However, if the Brain is used to analyze images that differ in a significant way - such as different products, lighting conditions, or manufacturing environment - the Brain's accuracy may be noticeably worse than the accuracy measured in Brain Builder.
It is critical to maintain consistent images during training and production to ensure that the trained Brain performs as well as it is expected to.
🎯 Brain accuracy
Brain Builder measures accuracy for each class on which the Brain has been trained and then averages those numbers into an overall accuracy calculation.
- For Classifiers, that score reflects the average accuracy of all of the classes on which the Brain has been trained.
- For Anomaly Recognizers, the overall accuracy is the average of the Normal and Anomaly accuracy scores.
- Detectors have their own accuracy metrics, as noted below.
Terminology - Classifier & Anomaly
Though there are a few differences in how accuracy is displayed for different types of Brains, much of the information on the Evaluate page is the same and uses consistent terminology.
| Term | Meaning - Classifier | Meaning - Anomaly |
|---|---|---|
| Accuracy | The percentage of Brain Predictions that are correct — either for a single class, or averaged for all classes. Accuracy is calculated as | The percentage of Brain predictions that are correct for both Normal and Anomaly images. Accuracy is calculated as |
| Precision | Precision is the measurement of how many of the Brain's predictions are correct for a given class (or averaged for all classes). For example, if the Brain makes 10 predictions of Class A, and 8 of those predictions are correct, then the Brain would have a precision of 80% for that class. Precision is calculated as | Precision is the Brain's ability to accurately identify instances of anomalies. Of all of the anomaly predictions the Brain makes, Precision is the percentage that are correct. Precision is calculated as |
| Recall | Recall measures the percentage of a class that the Brain correctly identifies. For example, if there are 10 images of Class A and the Brain correctly identifies 7 of them, then recall for that class is 70%. Recall is calculated as | Recall measures the Brain's ability to find Anomalies among all images in the Validation Dataset. Recall is the percentage of Anomalies that the Brain correctly finds. Recall is calculated as |
| True Positive (TP) | When the Brain's prediction matches the label of the image | The number of Normal images the Brain correctly classifies as Normal |
| False Positive (FP) | When the Brain's prediction does not match the label of the image | The number of Normal images the Brain incorrectly classifies as Anomalous |
| True Negative (TN) | Not applicable for this Brain type | The number of Anomaly images the Brain correctly classifies as Anomaly |
| False Negative (FN) | When the Brain does not predict the correct class for an image | The number of Anomaly images the Brain incorrectly classifies as Normal |
Anomaly True Positive SettingFor Anomaly Brains, Brain Builder allows the user to change whether True Positive refers to accurate Anomaly or Normal predictions. By default, correct Normal predictions are counted as True Positive results.
To better understand how the above terms apply, here are example results from different types of Brains.
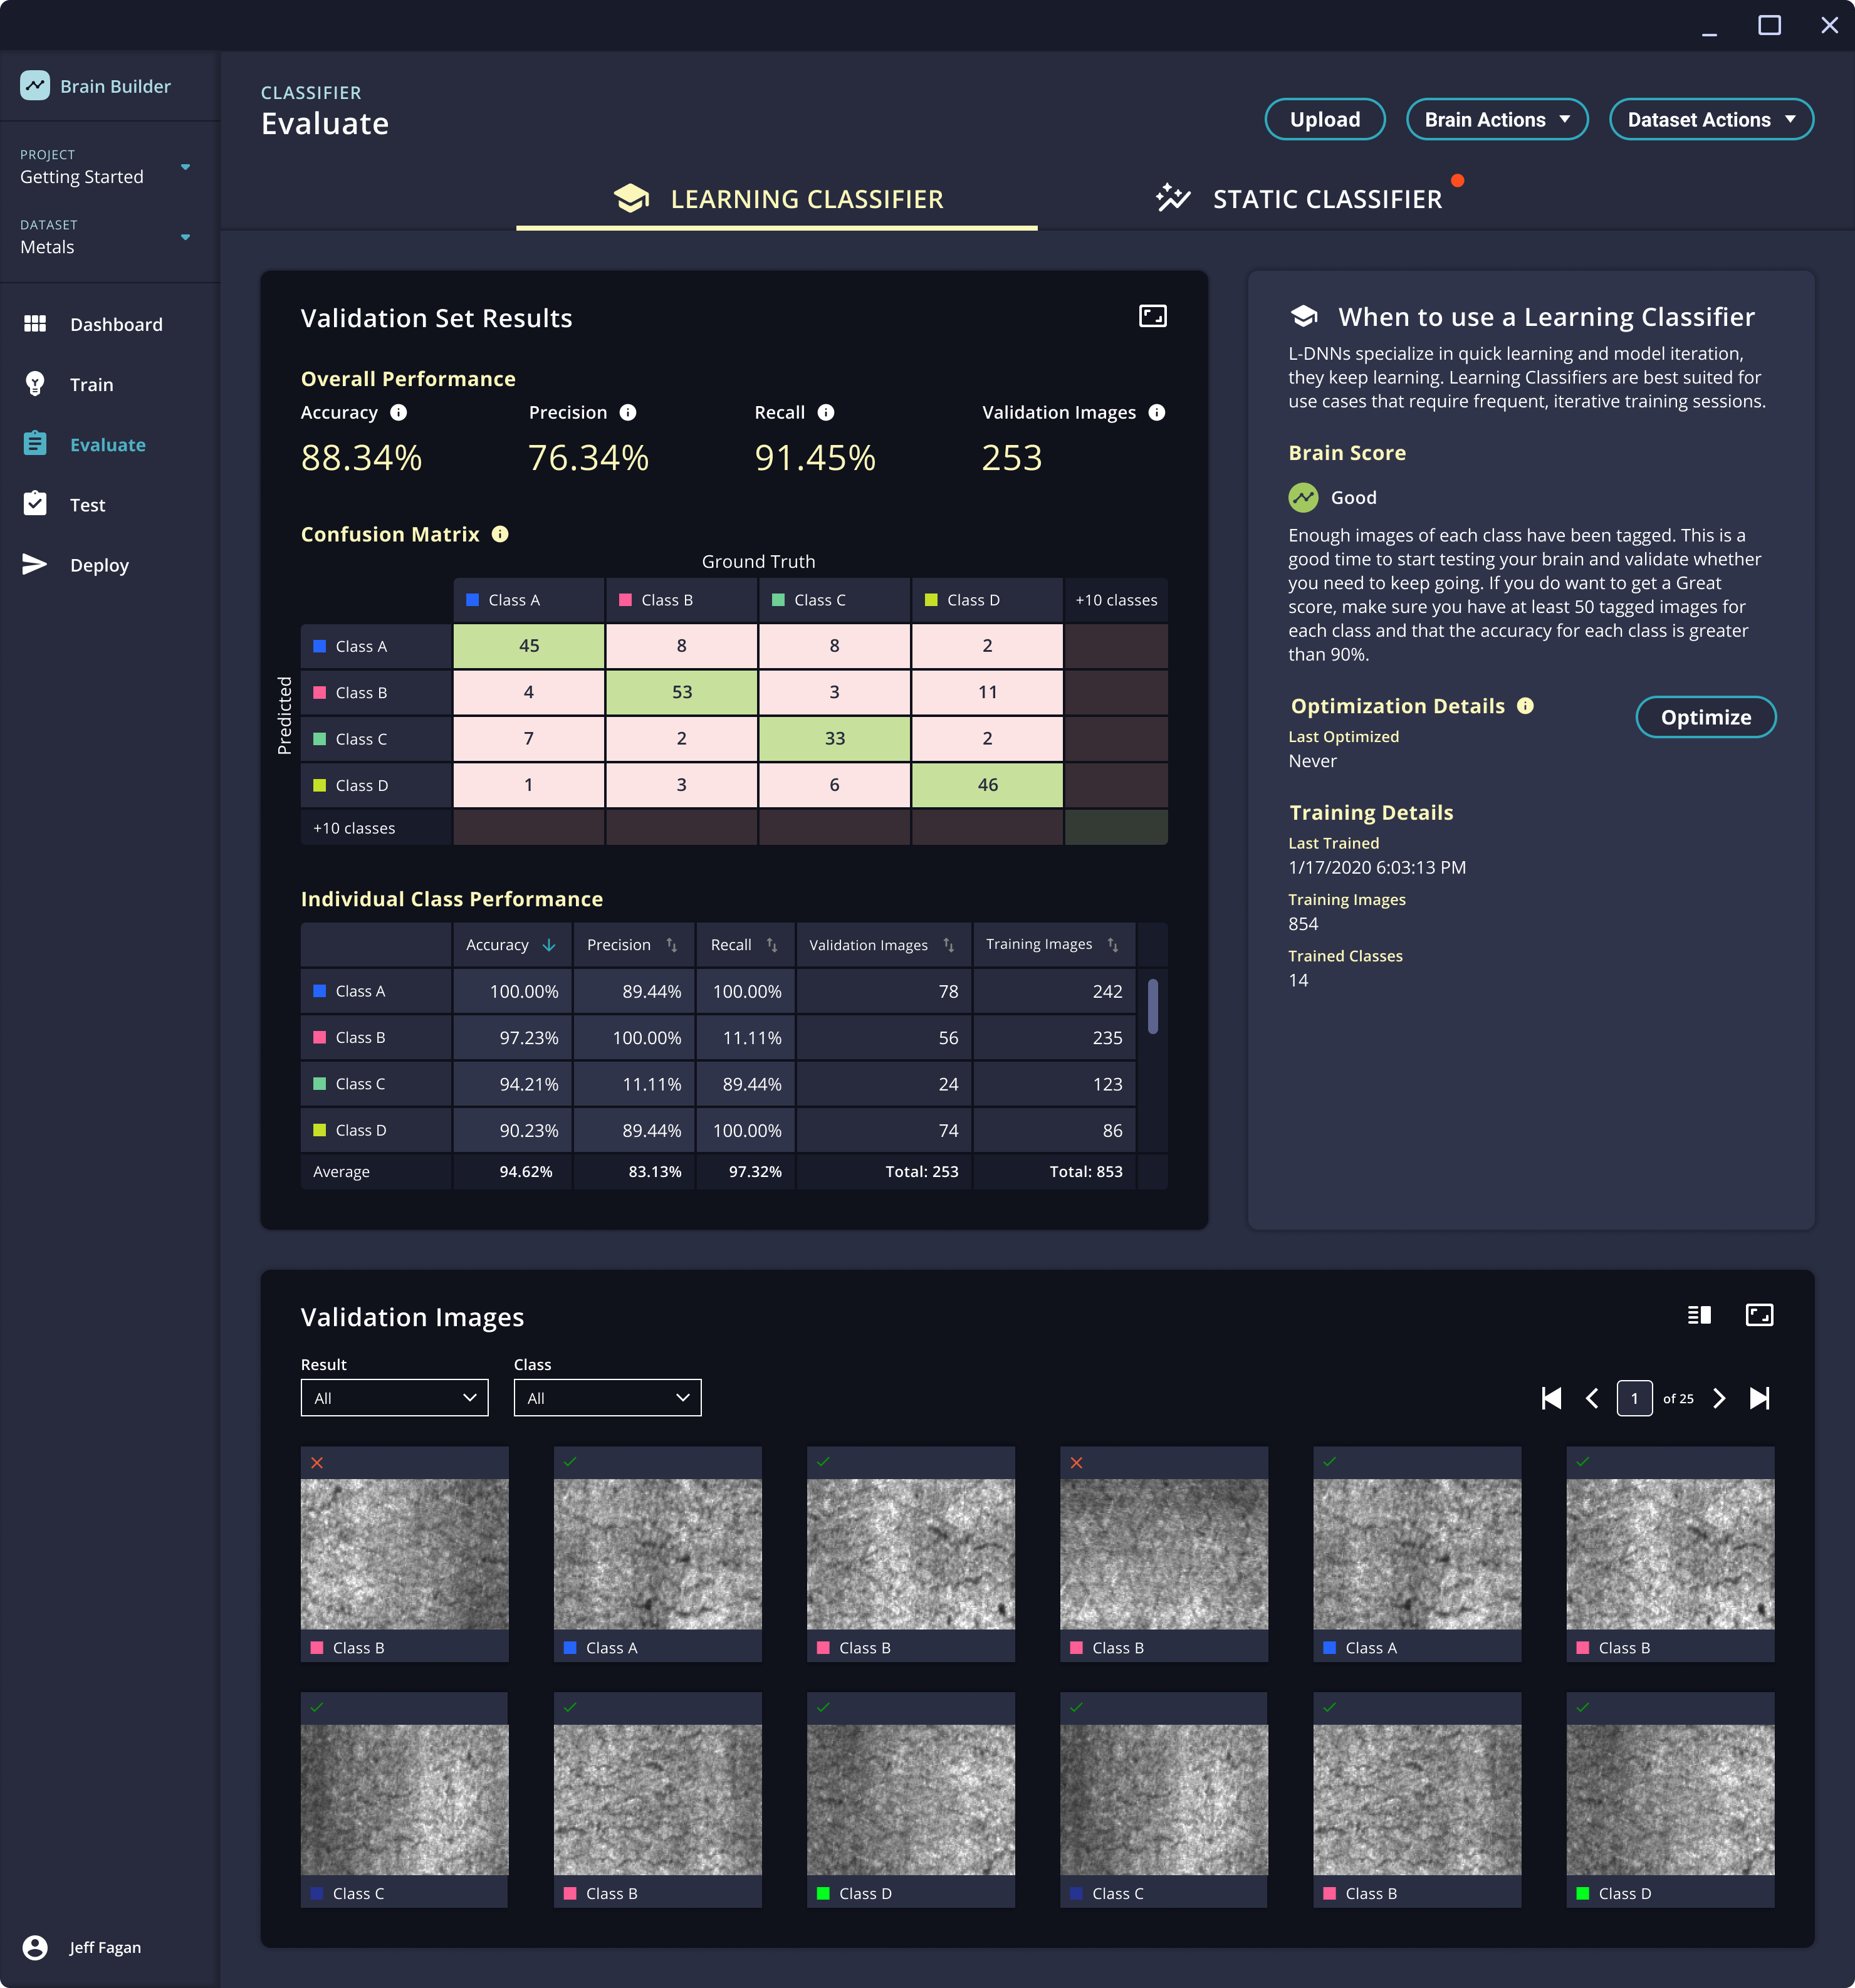
Example - Learning Classifier
| Class A (Label) | Class B (Label) | Class C (Label) | |
|---|---|---|---|
| Class A (Prediction) | 8 | 0 | 3 |
| Class B (Prediction) | 1 | 10 | 2 |
| Class C (Prediction) | 1 | 0 | 5 |
In this example, there are 10 validation images labeled for each of the three classes.
| Class | Recall | Precision |
|---|---|---|
| Class A | 8 images correctly identified out of 10 images labeled = 80% | 8 correct Class A predictions out of 11 total Class A predictions = 8/11 = 73% |
| Class B | 10 images correctly identified out of 10 images = 100% | 10 correct Class B predictions out of 13 total Class B predictions =77% |
| Class C | 5 images correctly identified out of 10 images = 50% | 5 correct Class C predictions out of 6 total Class C predictions = 83% |
Overall Metrics
- Accuracy = 23 correct predictions out of 30 total predictions = 23/30 = 77%
- Recall = 23 images correctly identified out of 30 total images = 23/30 = 77%
- Precision = 23 correct predictions out of 30 total predictions = 23/30 = 77%
Example - Anomaly Recognizer
| Normal (Label) | Anomaly (Label) | |
|---|---|---|
| Normal Prediction | 8 | 4 |
| Anomaly (Prediction) | 2 | 6 |
In this example, there are 10 validation images labeled for each class.
| Class | Recall | Precision |
|---|---|---|
| Normal | 8 images correctly identified out of 10 images = 80% | 8 correct Normal predictions out of 12 total Normal predictions = 67% |
| Anomaly | 6 images correctly identified out of 10 images = 60% | 6 correct Anomaly predictions out of 8 total Anomaly predictions = 75% |
Overall Metrics
- Accuracy = 14 correct predictions out of 20 total predictions = 70%
- Recall = 14 images correctly identified out of 20 images = 70%
- Precision = 14 correct predictions out of 20 total predictions = 70%
Brain Score
In addition to the calculated metrics above, Brain Builder offers a Brain Score.
The Brain Score is displayed at the top of the Workspace or on the right side of the Evaluate page.
The Brain Score can be any of the following:
- Still Learning - this means the Brain needs more images to get smarter. Keep tagging!
- Low - the Brain has enough images to calculate a score but it needs more knowledge. Keep tagging images to help the Brain get smarter.
- Good - the Brain is getting smarter! This is a good time to test the Brain and determine whether you need to keep going. If you want to keep going, consider Brain Builder's suggestions about which classes could use more images.
- Great - the Brain is a genius. Deploy it with Inspector.
The Brain score may also offer suggestions as to how to improve the results and achieve a higher score.
Adherence to Normal
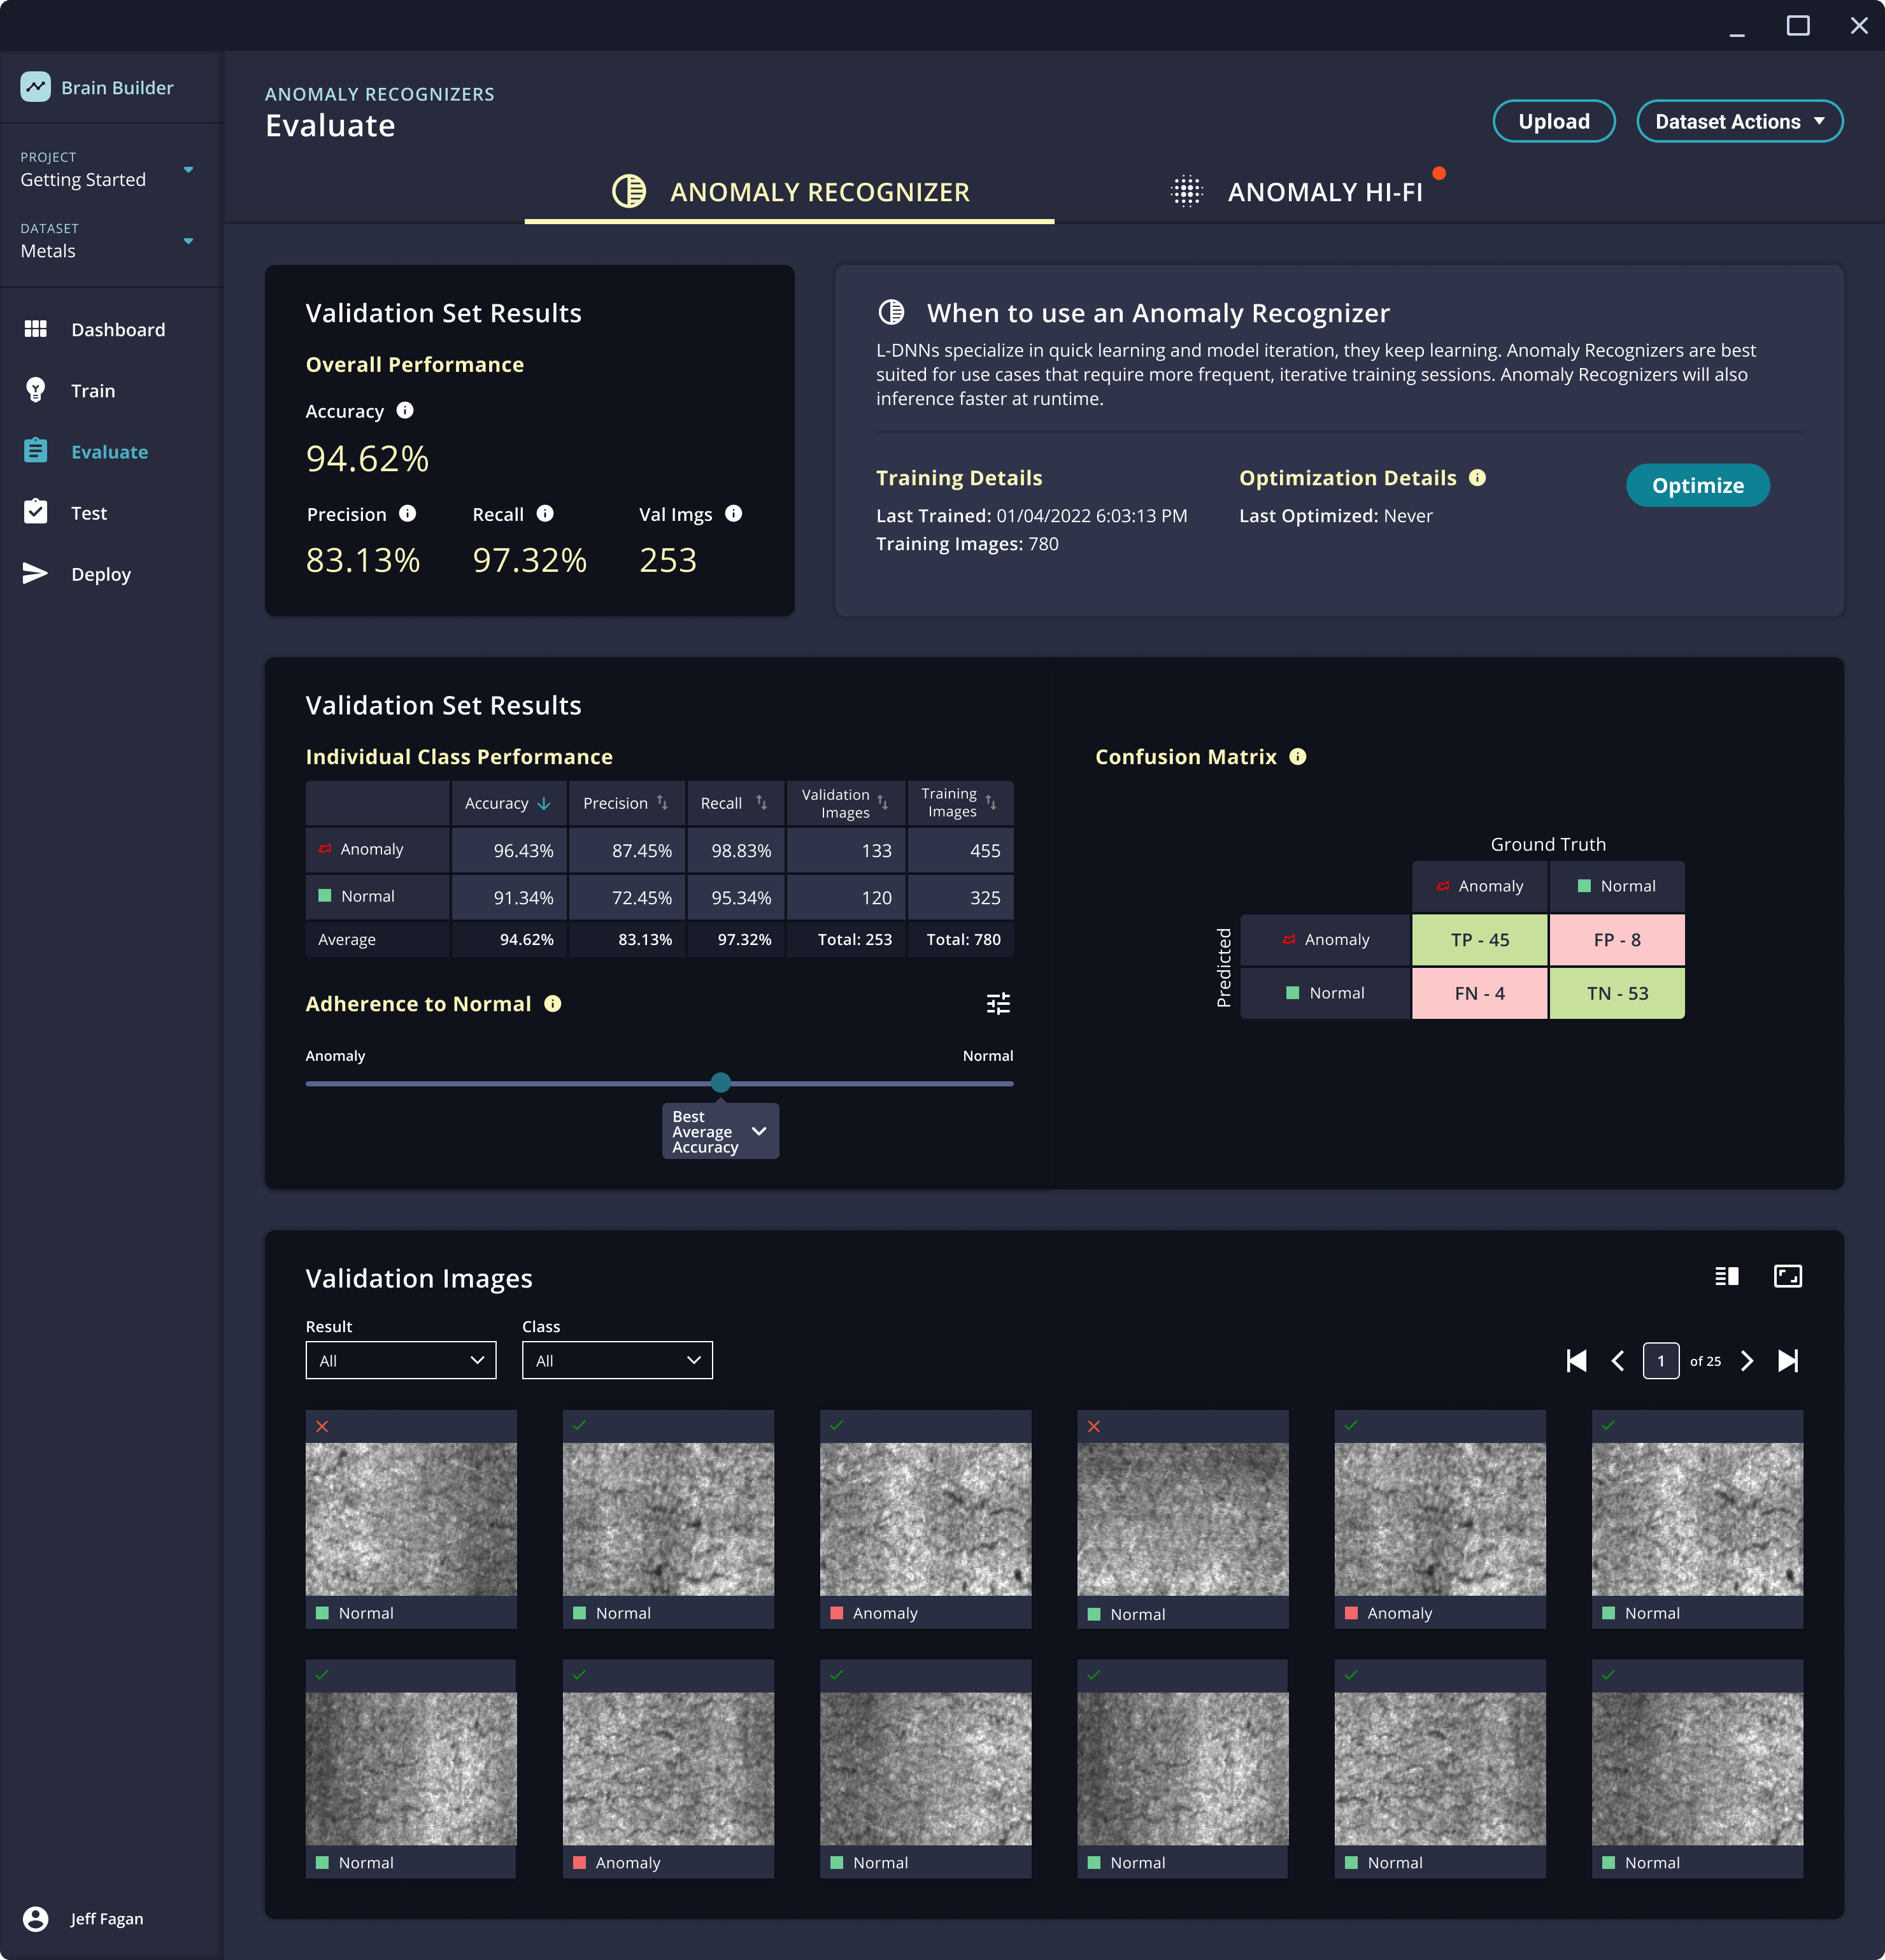
Anomaly Recognition and Anomaly Hi-Fi Brains can be tuned according to how closely the Brain's predictions should prioritize accuracy for either Normal or Anomaly results.
- Models with Best Anomaly Accuracy are tuned to find as many anomalies as possible, even if that means more Normal images are incorrectly identified as being Anomalies. This would be best used in an application where it is critical to miss as few anomalies as possible (e.g. pharmaceutical manufacturing).
- Models with Best Normal Accuracy are tuned to correctly identify as many Normal images as possible, even if that means some anomalies are missed. This might be used in an environment where the cost of defects (e.g. stopping the line) is very high and it is preferable to allow some defects to miss detection rather than have incorrect defect predictions.
- The default - Best Average Accuracy - balances these two considerations and tunes the model to return the highest average accuracy for both Anomaly and Normal images. This is the most appropriate selection for most use cases.
On the Evaluate page, this Adherence to Normal is displayed as a slider.
There are two ways to adjust the Adherence to Normal.
- Click the label on the slider and choose one of the pre-programmed options.
- Click the adjustment icon to the top-right of the slider then manually drag the slider from side to side. The accuracy results will adjust as the slider moves. When the results are tuned to the user's satisfaction, click Save Threshold to apply the new setting.
Terminology - Detector
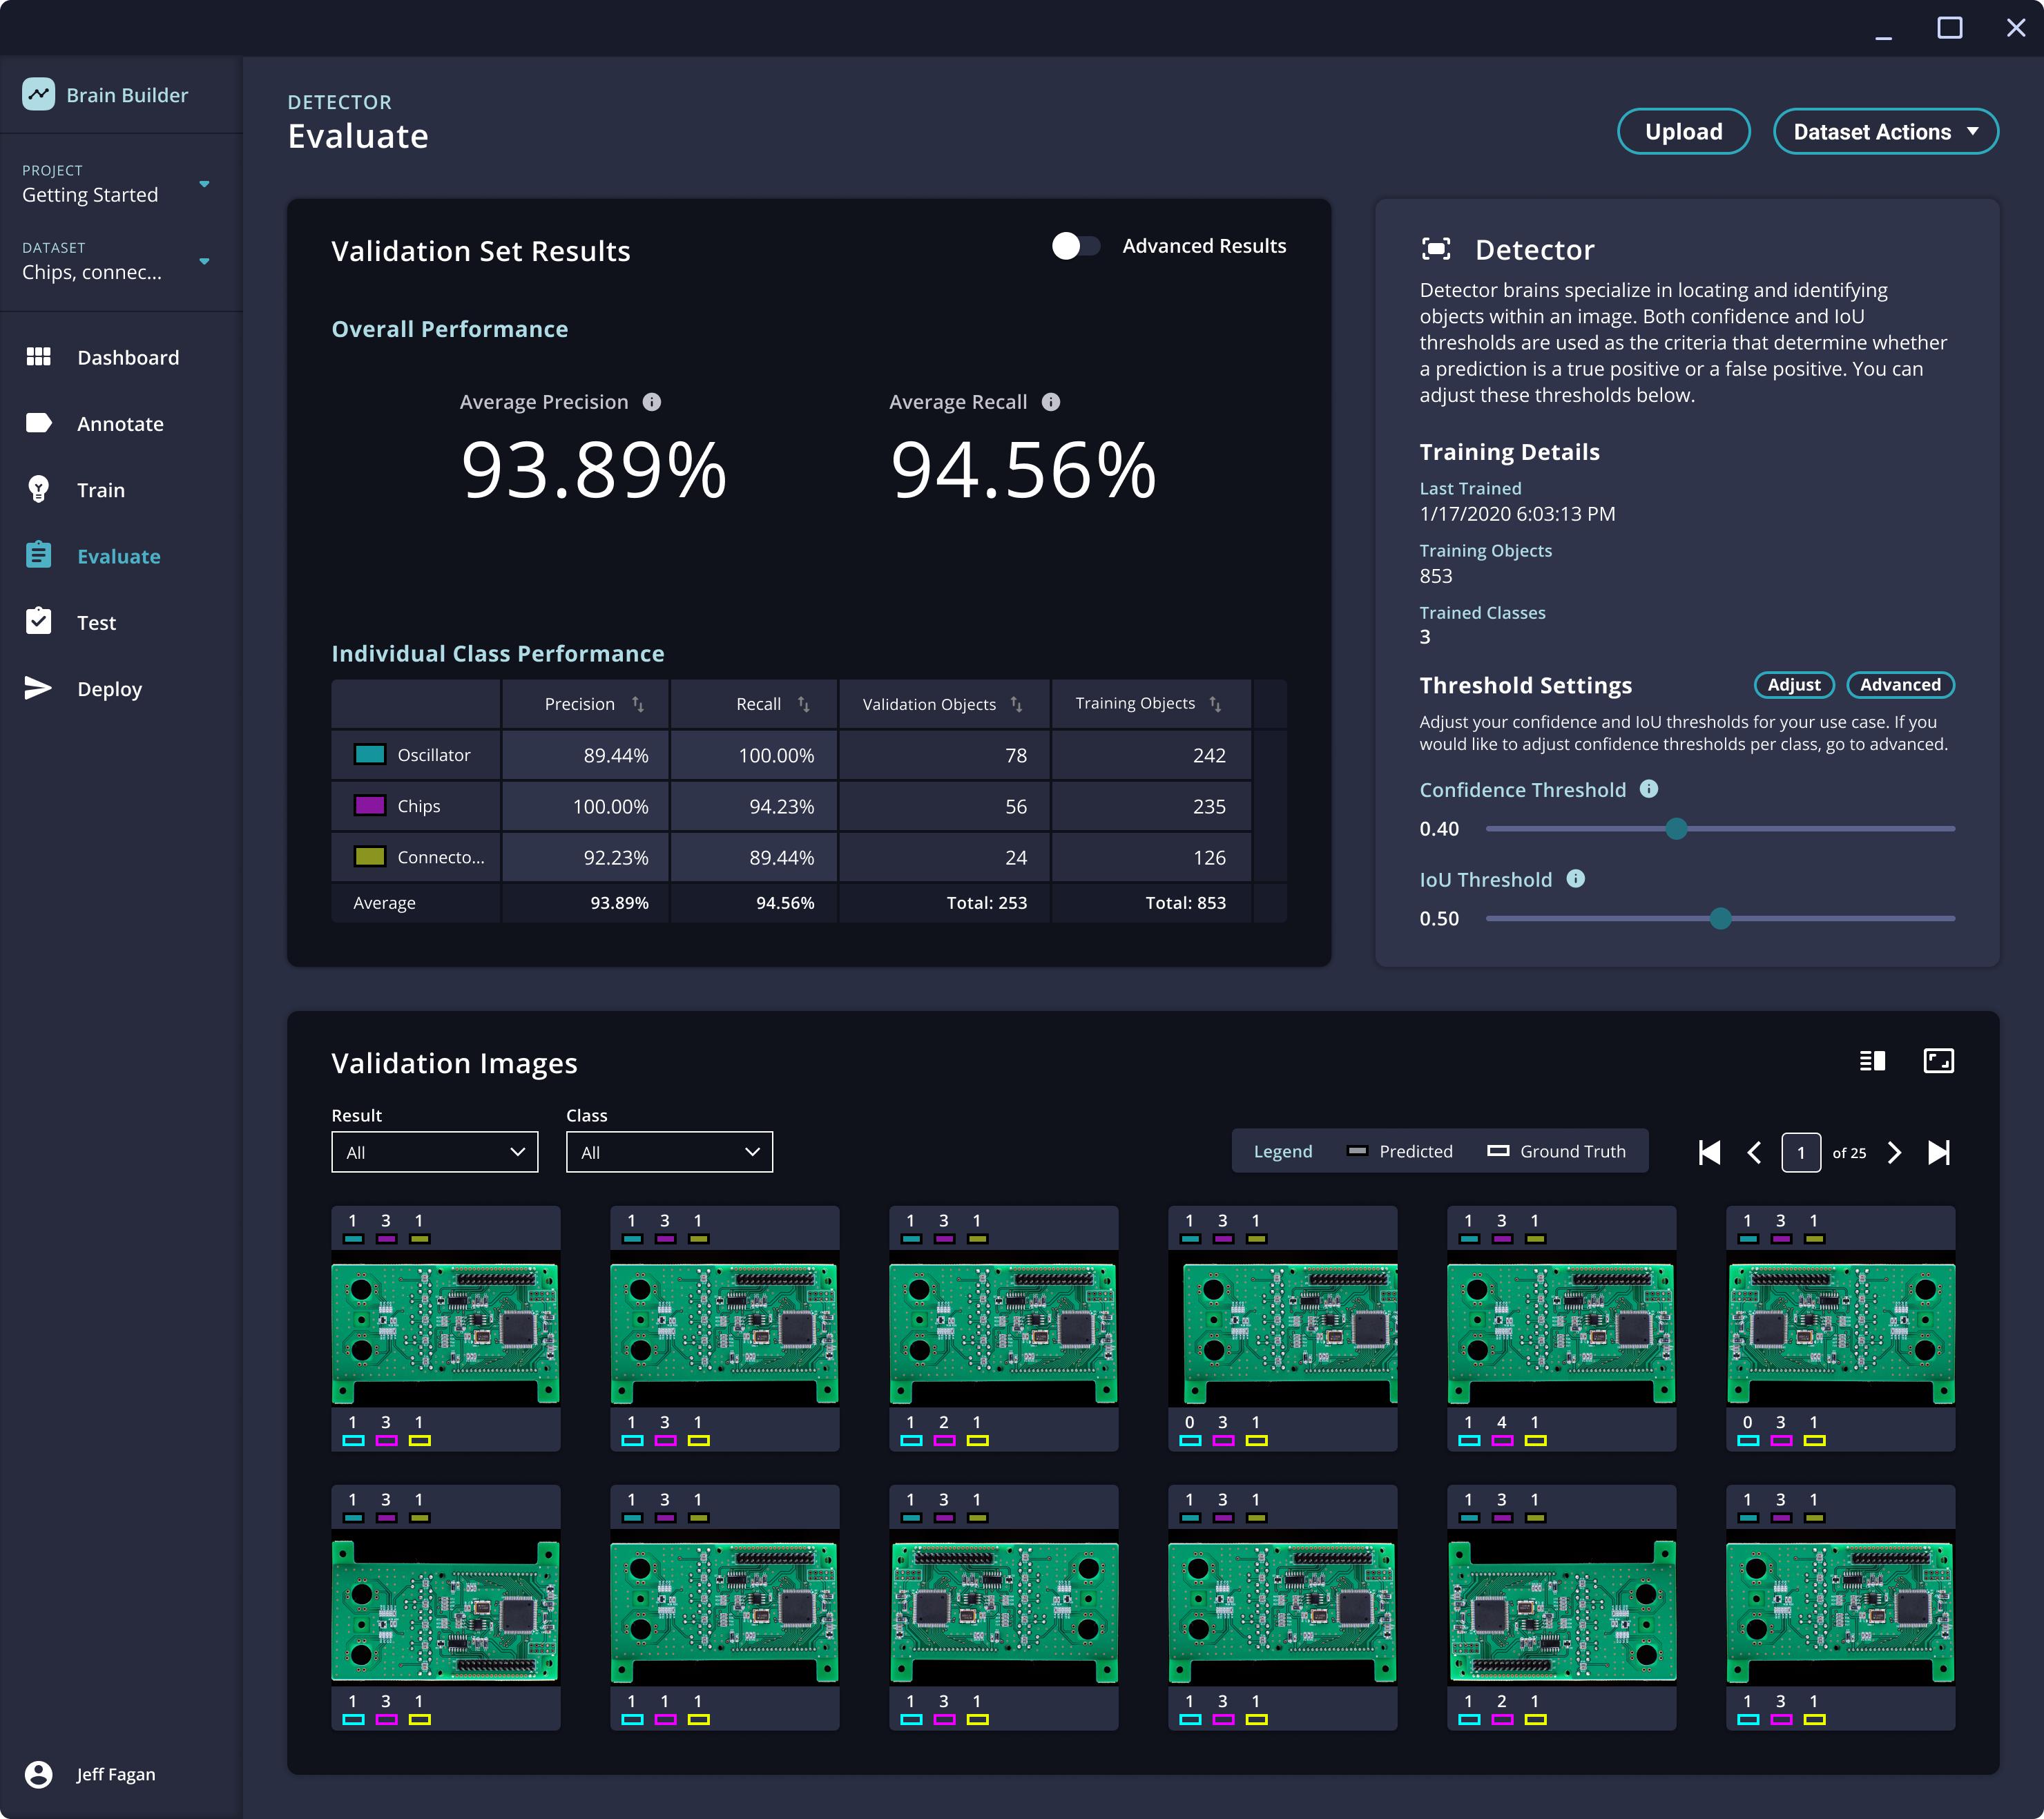
Detection models display additional metrics to help understand their performance.
- Average Precision is the average of the precision values for all classes. Precision is the ratio of the number of correct predictions to the total number of predictions. For example, if the model detects 100 objects, and 90 of those predictions are correct, the precision would be 90%.
- Average Recall is the average of the recall values for all classes. Recall is the ratio of the number of correct predictions to the total number of objects that should be identified. For example, if the model correctly detects 75 objects in an image and there are actually 100 objects, then the recall is 75%.
- miAP stands for "mean interpolated average precision." (The term "mean average precision (mAP)" is often used interchangeably with miAP.) Brain Builder can display two versions of miAP.
- The "COCO" version of this metric measures the mean average precision across multiple IoU thresholds.
- The "VOC" version of this metric measures the mean average precision at a single IoU threshold.
✅ Validation set
The images in the Validation Set are shown at the bottom of the Evaluate page. Each image is displayed as a thumbnail with a mark indicating whether the Brain correctly identified it (shown as a check mark or red X).
Users can filter the display of the images in the Validation Set by result (Correct or Incorrect prediction), or by Class.
The view of the Validation set can be changed using the icons at the top-right to enlarge the view to one image at a time or expand the view to display more thumbnails.
🪄 Optimization
When experts in AI technology build models, they do not train a single model and assume its results are the best that is possible. AI experts can train dozens of models for a use case using variations in model architecture and training parameters to achieve the best possible accuracy for the data and use case that the model is addressing.
Within Brain Builder, Neurala has built the Optimize feature to replicate this process of testing and iterating with multiple model architectures and training parameters to develop the model that will deliver the best results for the specific data it is being used to analyze.
Optimizable modelsOptimize is available for Learning Classifier and Anomaly Recognizer models. The build process for Static Classifiers, Anomaly Hi-Fi, and Detectors performs many of the same steps to optimize performance.
How to optimize the Brain
- On the Evaluate page, click the Optimize button.
- In the optimize window, examine the available options and make changes to any that should be adjusted from their defaults.
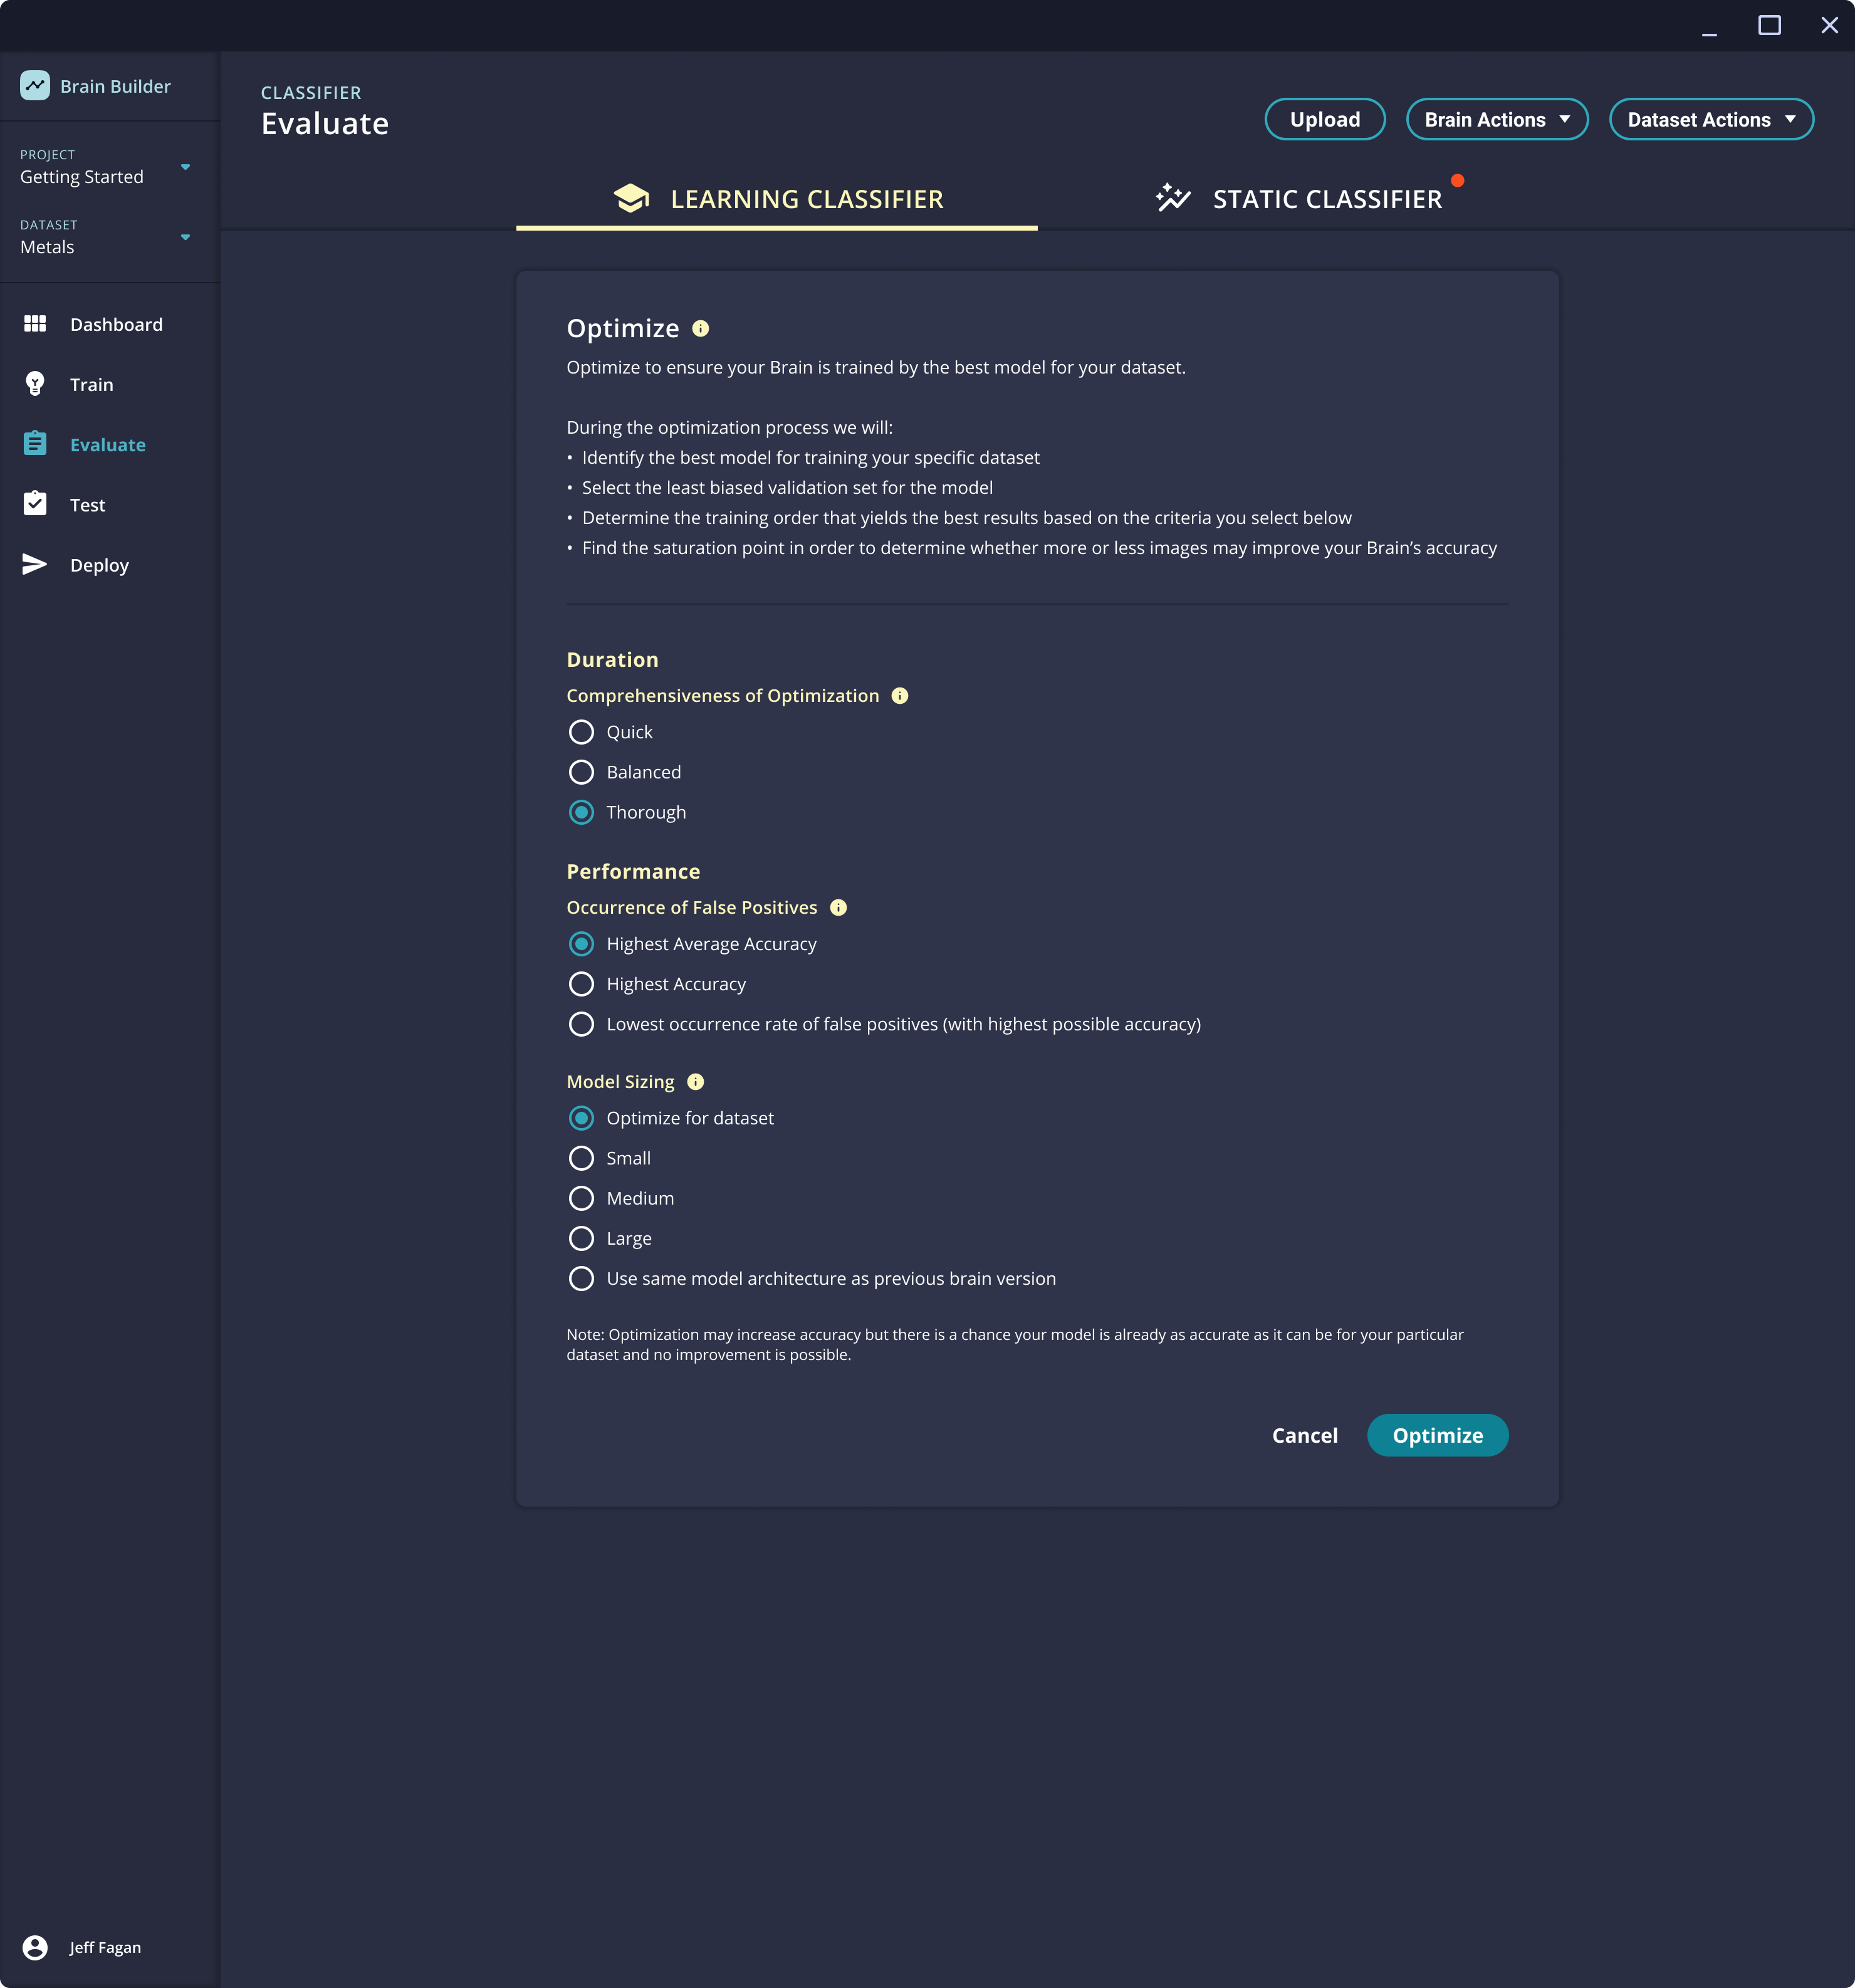
- Comprehensiveness of Optimization impacts how quickly optimization will run and how thorough it will evaluate different model options.
- Occurrence of False Positives tunes whether the model should be optimized for the highest number of correct predictions (true positive) or the lowest number of incorrect predictions (false positives). This option is only available for Learning Classifiers.
- Model Sizing limits the types of model architectures that are available during optimization.
- After options have been selected, click Optimize. The process will run and a progress bar will indicate the approximate amount of time remaining. The Optimize window may be closed while this process runs.
- When Optimization is complete, Brain Builder will prompt the user to return to the Evaluate page to examine the performance of the optimized Brain.
💡 Interpreting accuracy information
The information displayed on the Evaluate page can help users understand when the Brain is ready to be used, and it can provide insight as to what steps might be helpful to improve performance. The ability to review each image in the Validation Set can help identify types of images that are consistently incorrect. That may point to problems in the data collection process (e.g. lighting variation) that are confusing the Brain.
While it's normal to want (or expect) perfect results - 100% accuracy, precision, and recall - such results may be impractical or impossible for certain datasets. Furthermore, different use cases likely have different performance requirements.
- Some use cases may call for high recall over high precision. These would be situations where it is critical to identify all anomalies, even if that results in some normal images being erroneously categorized as anomalous. One example use case that fits this category is manufacturing of medication, in which it would be terrible for an incorrect pill to be included in a package, while it would be acceptable for a Normal package to be incorrectly discarded.
- In other use cases it might be better to achieve high precision, to miss some anomalies rather than incorrectly identify Normal images as anomalous. This might be true for production lines where it is incredibly expensive to stop the line for defects that might not be mission-critical or otherwise disqualifying.
Improving accuracy
If the accuracy of the trained Brain is not as high as is needed for the use case, there are a number of steps that can be taken to improve the accuracy.
- Run Optimization.
- Use the ROI tool to focus the Brain on a specific area of the image that are important for the use case.
- Upload additional images to better train the Brain.
- Examine the images in the validation set with incorrect predictions. Look for common features that may be causing the Brain to not get them right. This may point to variables outside of Brain Builder that should be adjusted to improve performance, such as more consistent lighting or image capturing processes.
Updated 12 months ago